Detecting Solar Flares, More in Real Time
New machine learning tool can improve space weather forecasts, understanding of solar data
Computers can learn to find solar flares and other events in vast streams of solar images and help NOAA forecasters issue timely alerts, according to a new study. The machine-learning technique, developed by scientists at CIRES and NOAA’s National Centers for Environmental Information (NCEI), searches massive amounts of satellite data to pick out features significant for space weather. Changing conditions on the Sun and in space can affect various technologies on Earth, blocking radio communications, damaging power grids and diminishing navigation system accuracy.
“Being able to process solar data in real time is important because flares erupting on the Sun impact Earth over the course of minutes. These techniques provide a rapid, continuously updated overview of solar features and can point us to areas requiring more scrutiny,” said Rob Steenburgh, a forecaster in the NOAA Space Weather Prediction Center (SWPC) in Boulder.
The research was published in October in the Journal of Space Weather and Space Climate.
Capturing Information From Steady Streams of Solar Data
To predict incoming space weather, forecasters summarize current conditions on the Sun twice daily. Today, they use hand-drawn maps labeled with various solar features—including, active regions, filaments and coronal hole boundaries. But solar imagers produce a new set of observations every few minutes. For example, the Solar Ultraviolet Imager (SUVI) on NOAA’s GOES-R Series satellites runs on a 4-minute cycle, collecting data in six different wavelengths every cycle.
![]() The Solar Ultraviolet Imager (SUVI) on NOAA’s GOES-R Series satellites collect data in six different wavelengths or passbands, corresponding to different temperatures. Together, these images paint a complete picture of a variety of coronal phenomena. SUVI captured these images of the corona just after a large solar flare on September 10, 2017. Image: Dan Seaton/CIRES & NCEI
The Solar Ultraviolet Imager (SUVI) on NOAA’s GOES-R Series satellites collect data in six different wavelengths or passbands, corresponding to different temperatures. Together, these images paint a complete picture of a variety of coronal phenomena. SUVI captured these images of the corona just after a large solar flare on September 10, 2017. Image: Dan Seaton/CIRES & NCEI
Just keeping up with all of that data could take up a lot of a forecaster’s time. “We need tools to process solar data into digestible chunks,” said Dan Seaton, a CIRES scientist working at NCEI and one of the paper’s co-authors. CIRES is part of the University of Colorado Boulder.
Training Computers to Identify Solar Features
So J. Marcus Hughes, a computer science graduate student at CU Boulder, CIRES scientist in NCEI and lead author of the study, created a computer algorithm that can look at all the SUVI images simultaneously and spot patterns in the data. With his colleagues, Hughes created a database of expert-labeled maps of the Sun and used those images to teach a computer to identify solar features important for forecasting. “We didn’t tell it how to identify those features, but what to look for—things like flares, coronal holes, bright regions, filaments and prominences. The computer learns the how through the algorithm,” Hughes said.
The algorithm identifies solar features using a decision-tree approach that follows a set of simple rules to distinguish between different traits. It examines an image one pixel at a time and decides, for example, whether that pixel is brighter or dimmer than a certain threshold before sending it down a branch of the tree. This repeats until, at the very bottom of the tree, each pixel fits only one category or feature—a flare, for example.
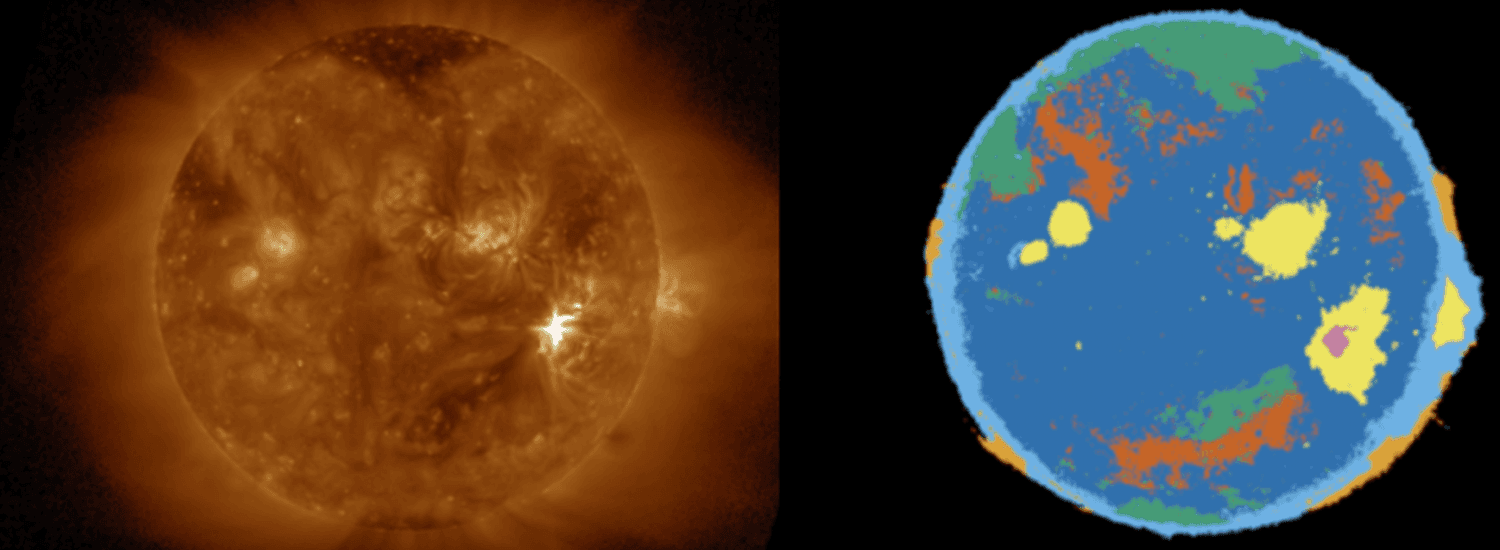
![]() The SUVI thematic map (right) produced by the new algorithm tracks changes in the Sun (left) over time. In the thematic map, different colors correspond to different themes: yellow corresponds to active regions, while dark blue shows quiet solar regions. Animation: J. Marcus Hughes/CU Boulder, CIRES & NCEI
The SUVI thematic map (right) produced by the new algorithm tracks changes in the Sun (left) over time. In the thematic map, different colors correspond to different themes: yellow corresponds to active regions, while dark blue shows quiet solar regions. Animation: J. Marcus Hughes/CU Boulder, CIRES & NCEI
The algorithm learns hundreds of decision trees—and makes hundreds of decisions along each tree—to distinguish between different solar features and determine the “majority vote” for each pixel. Once the system is trained, it can classify millions of pixels in seconds, supporting forecasts that could be routine or require an alert or warning.
“This technique is really good at using all the data simultaneously,” Hughes said. “Because the algorithm learns so rapidly it can help forecasters understand what’s happening on the Sun far more quickly than they currently do.”
Improving Solar Models and Space Weather Forecasts
The technique also sees patterns humans can’t. “It can sometimes find features we had difficulty identifying correctly ourselves. So machine learning can direct our scientific inquiry and identify important characteristics of features we didn’t know to look for,” Seaton said.
The algorithm’s skill at finding patterns is not only useful for short-term forecasting, but also for helping scientists evaluate long-term solar data and improve models of the Sun. “Because the algorithm can look at 20 years’ worth of images and find patterns in the data, we’ll be able to answer questions and solve long-term problems that have been intractable,” Seaton said.
![]() NOAA’s Space Weather Prediction Center in Boulder, Colorado. Photo: Katie Palubicki/ CIRES & NCEI
NOAA’s Space Weather Prediction Center in Boulder, Colorado. Photo: Katie Palubicki/ CIRES & NCEI
NCEI and SWPC are still testing the tool for tracking changing solar conditions so forecasters can issue more accurate watches, warnings, and alerts. The tool could be made officially operational as early as the end of 2019.